
Chrome is the best, so we'll use that.
Right-click on the page and select Inspect Element OR Click the ≡ symbol and go to More Tools, Developer Tools.
If there's an error, it'll be highlighted in red in the Console tab. To the right, you can see the file that had the problem; click on it to view the code.
If you don't see any error messages but still want to examine the code to put
in breakpoints --select the Sources tab: 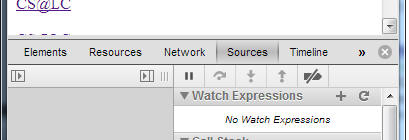
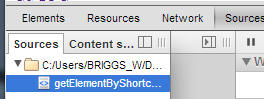
Then select the source file you want.
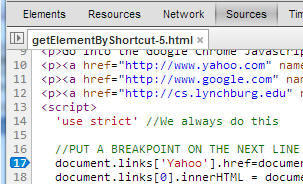
Click on the line number of a piece of code to put a breakpoint on that line.
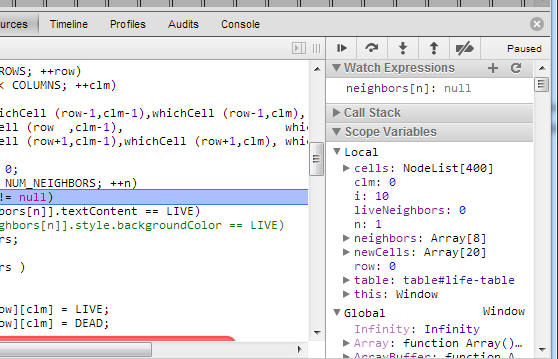
They're under Scope Variables. If you can't find them, it's likely because they're not in a function and are thus Global -- meaning they're lost among a host of built-in variables. But you can find them.
Or you can write a Watch Expression so you can see a variable or a calculated expression conveniently (as shown).
Don't bother editing the code -- it won't save it. Edit in Expression and reload.
To do this, reload the page in the browser.